Azureus's stunning visualizations (Vuze)
In order to get around Bell Sympatico’s bittorrent throttling I recently switched to Azureus (aka Vuze). If you switch to the “classic” UI mode, it has some stunning visualizations of what’s happening with your torrents.
The main screen contains a bit more information than you might need, but if you play with the columns that are visible (right click on the headers) you can get something like this:
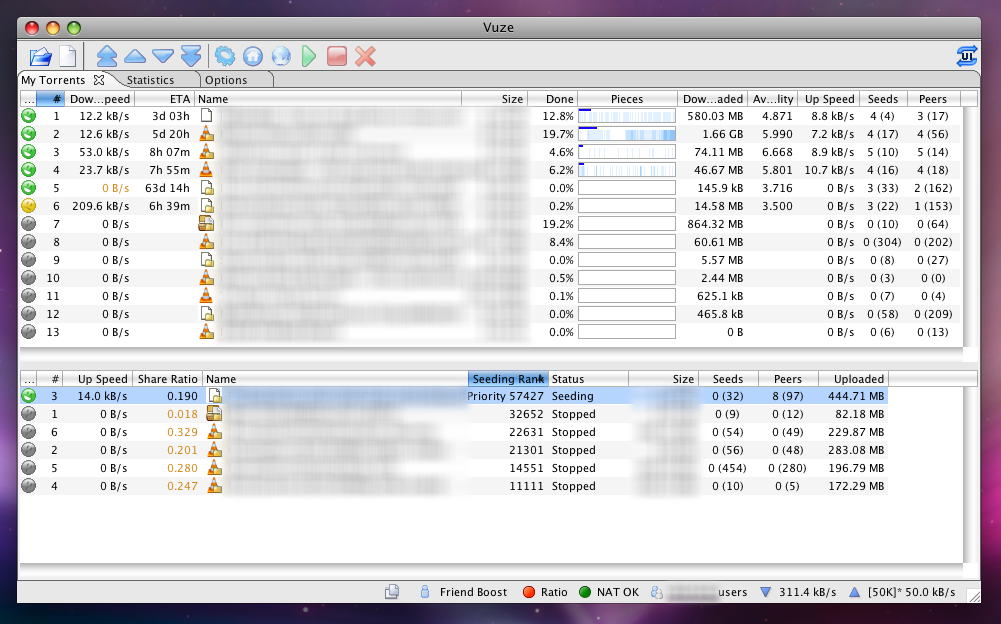
What you’ve got there is downloading torrents at the top and finished ones at the bottom. Green happy faces are currently in progress. Gray ones are queued. In the bottom right corner you can see that my total download speed is 311 kilobytes per second, and total upload is 50kB/s (I’m on ADSL).
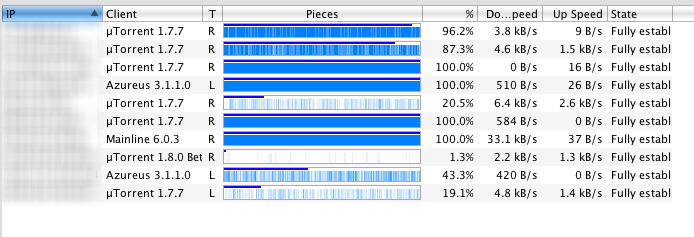
Suppose I want to zoom in on one particular torrent – double click on it. This shows each of the peers I’m connected to. What pieces of the file do they have? How far complete are they in total? Bittorrent downloads files in chunks and it does the chunks randomly, not from start to end, so this information can be interesting.
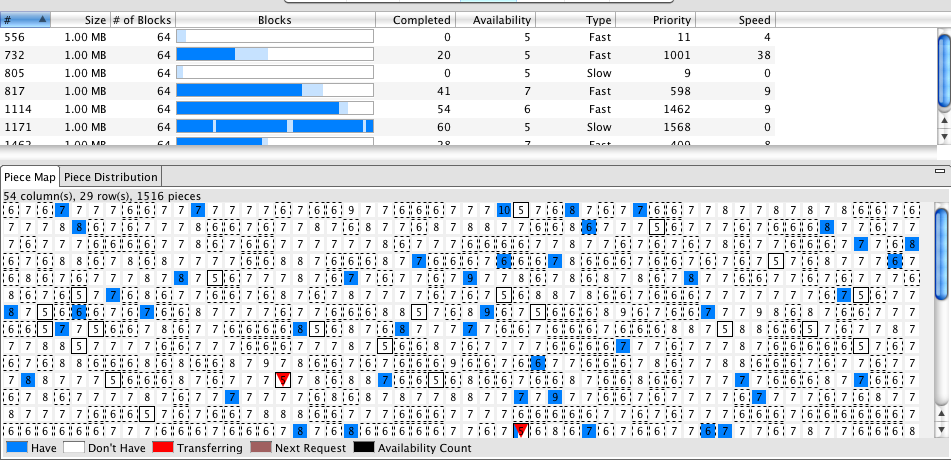
The above shows me EVEN MORE details if I really want it (OK, some of this stuff is really excessive). It shows which of the pieces I’ve got (blue) and which ones are downloading (in red). Just in case you wanted to know…
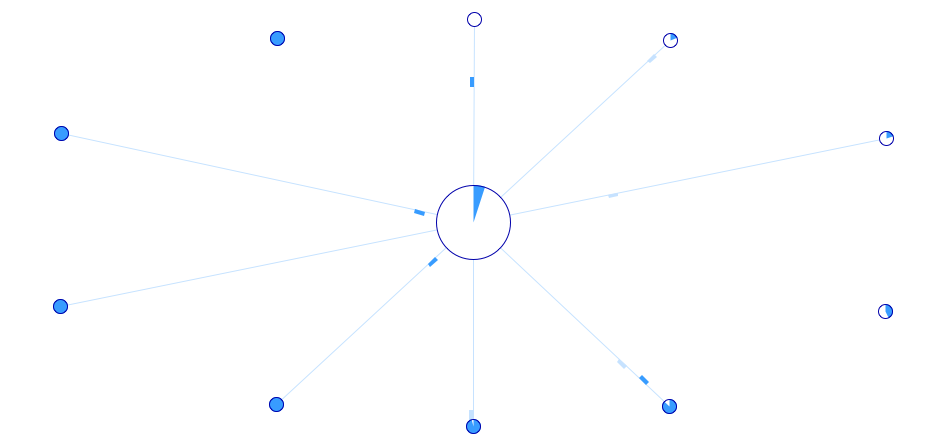
Swarm (above) is an actual animation of the pieces of the file as each of your peers around the edges send the bits to you in the middle. And it also shows the reverse as well. And the pie charts show how much of the torrent each peer has. Wild stuff.
So, that’s if you want to know what’s happening with one particular torrent. But what if you want to know about your overall connection with all the different peers and torrents? Well, Azureus gives loads of graphs and charts for that as well.
This one is your overall bandwidth monitor:
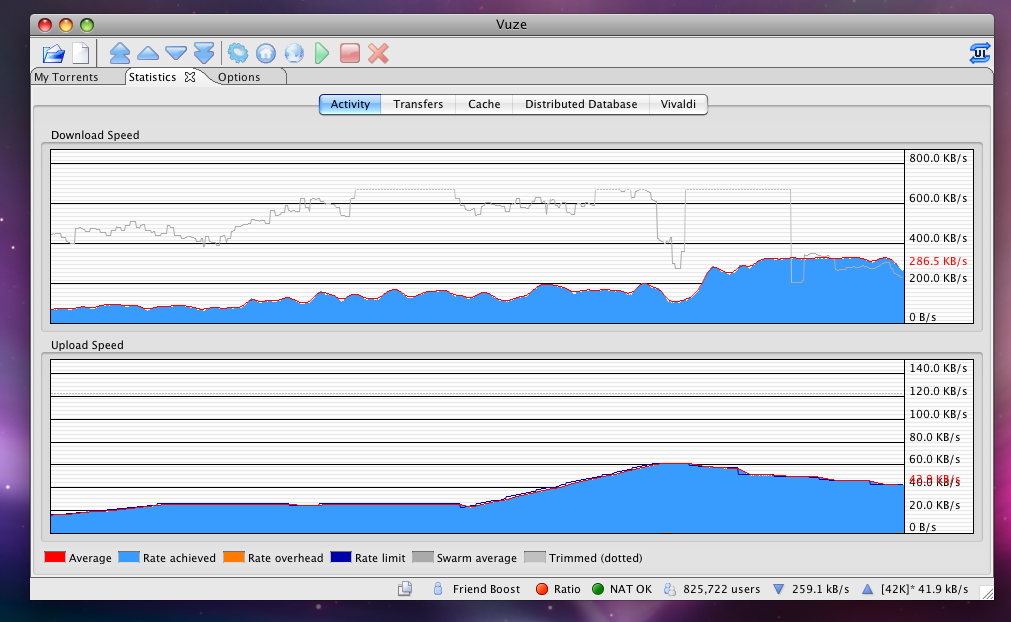
Nice. I love staring at this one. It’s a really good example about how to cleanly show multiple related variables in a time-based chart (aka histogram). For the top one, the blue filled area is your download speed. Really interesting is the gray line, which is the average download speed of the SWARM. In other words, what is your average peer getting? If you’re below this line, then you’re getting screwed – or there’s something wrong with your configuration. If you’re above it, you’re doing well. It’s a good way to get a quick fix on the health of your downloads as compared to other users. It also makes it really easy to see if you’re being rate-limited by your ISP.
On the bottom half, you can see that I’ve enabled Auto-Speed and it’s automatically cranking the max upload speed up and down based on measuring my bandwidth and other factors that I’m not too clear on.
There’s other visualizations but those are my favourites. Some of them aren’t really documented and I don’t really understand exactly what they mean (transfers and vivaldi for example). Still, obviously one of the azureus open source developers is a data viz keener and s/he’s done some fine work.